3D Biodistribution Visualization
Interactive visualization of organ-specific radiotracer uptake and clearance kinetics based on VISION trial dosimetry data.
Organ Color Coding
Uptake Mapping
Anatomical Reference - Click for Details
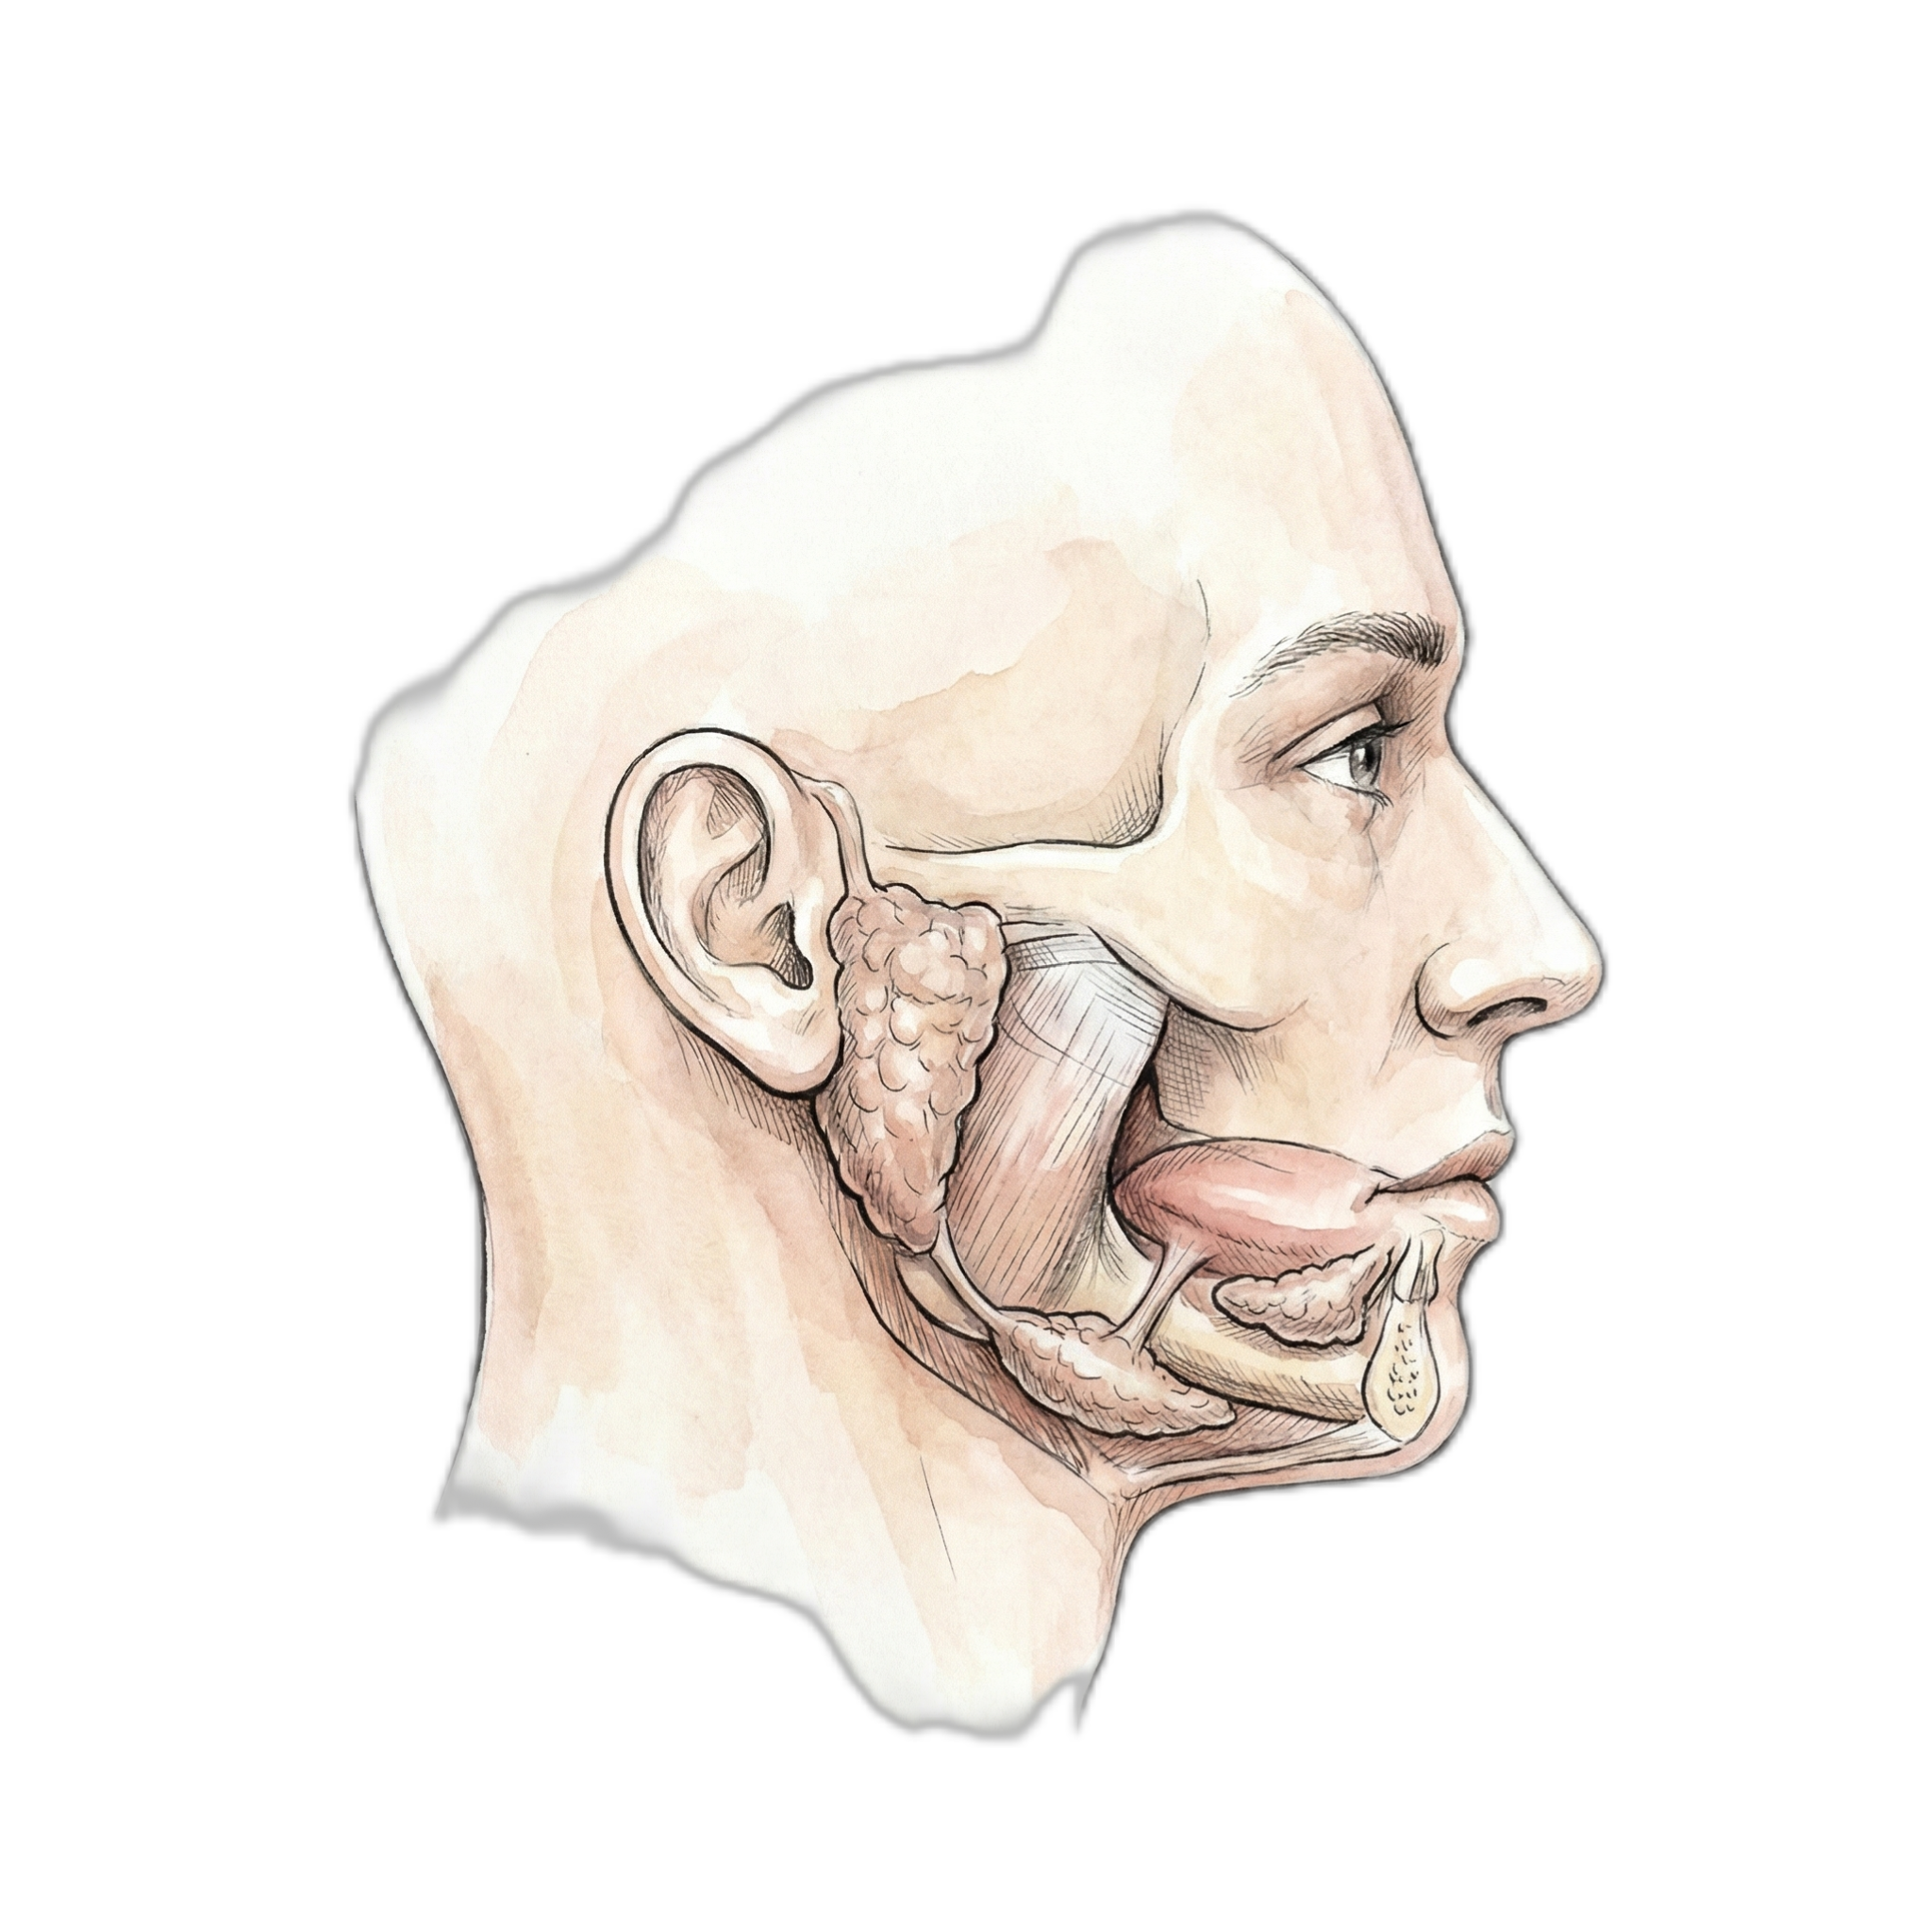
Salivary Glands
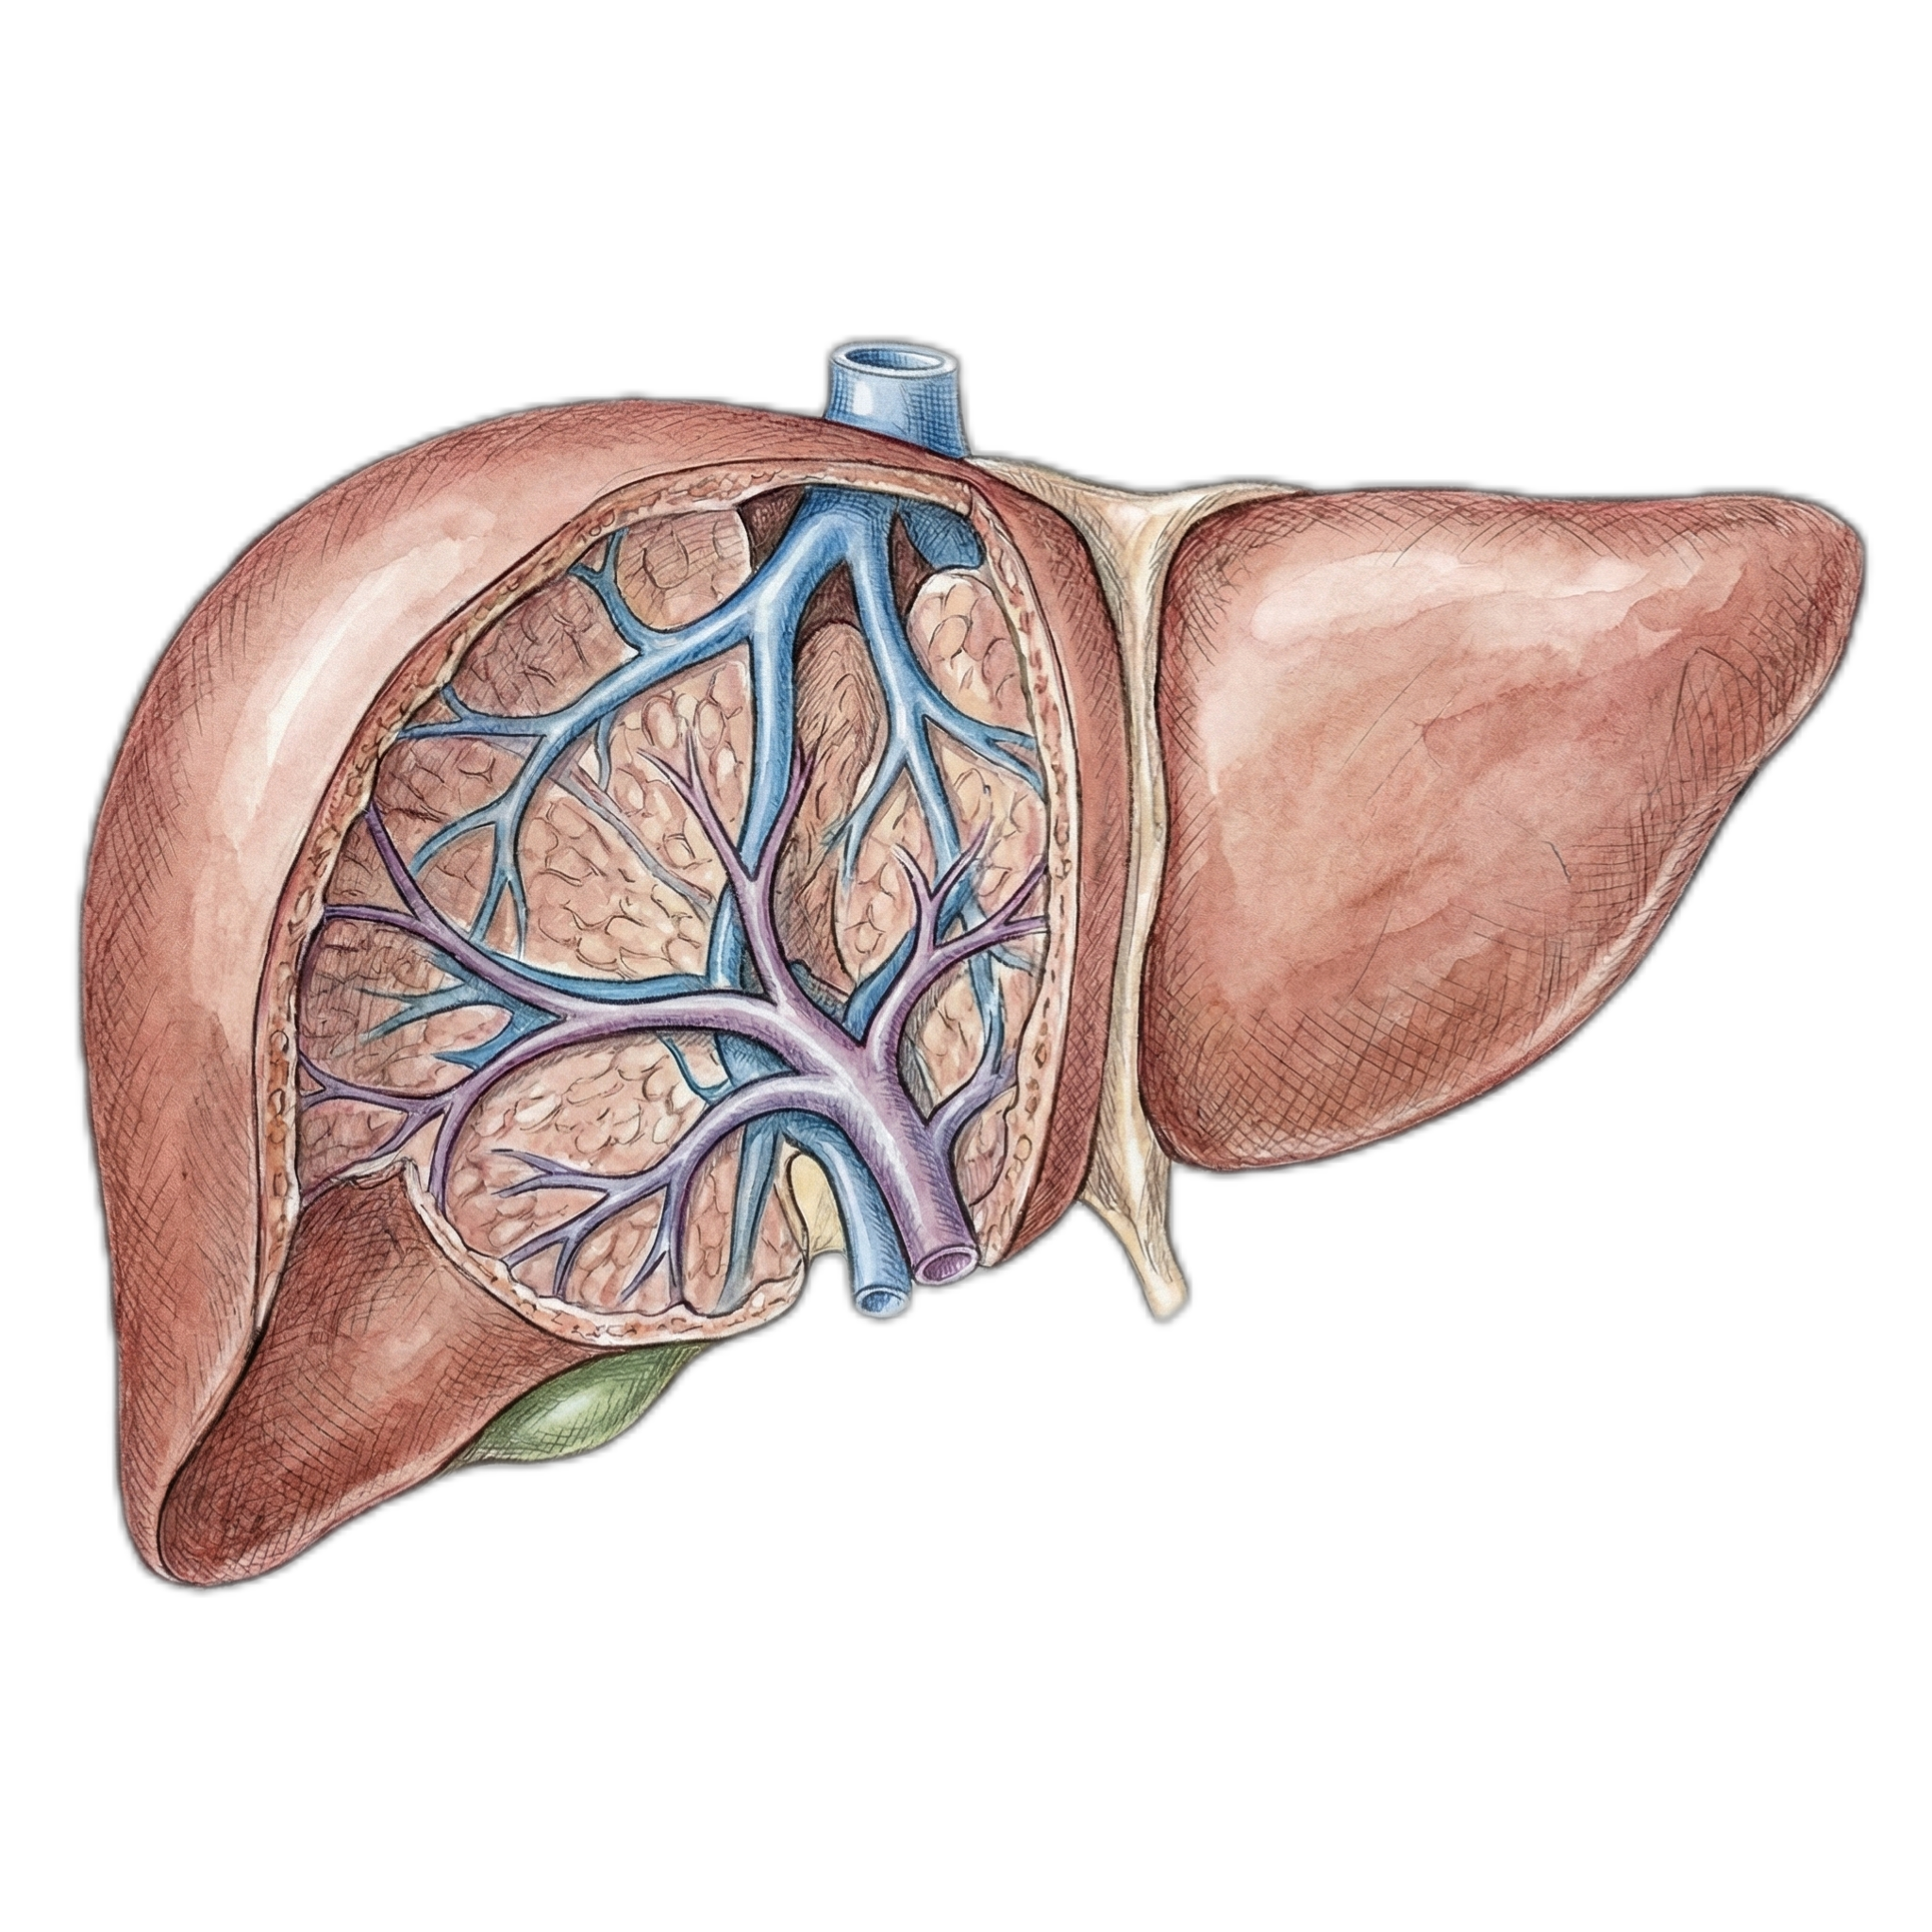
Liver
Spleen
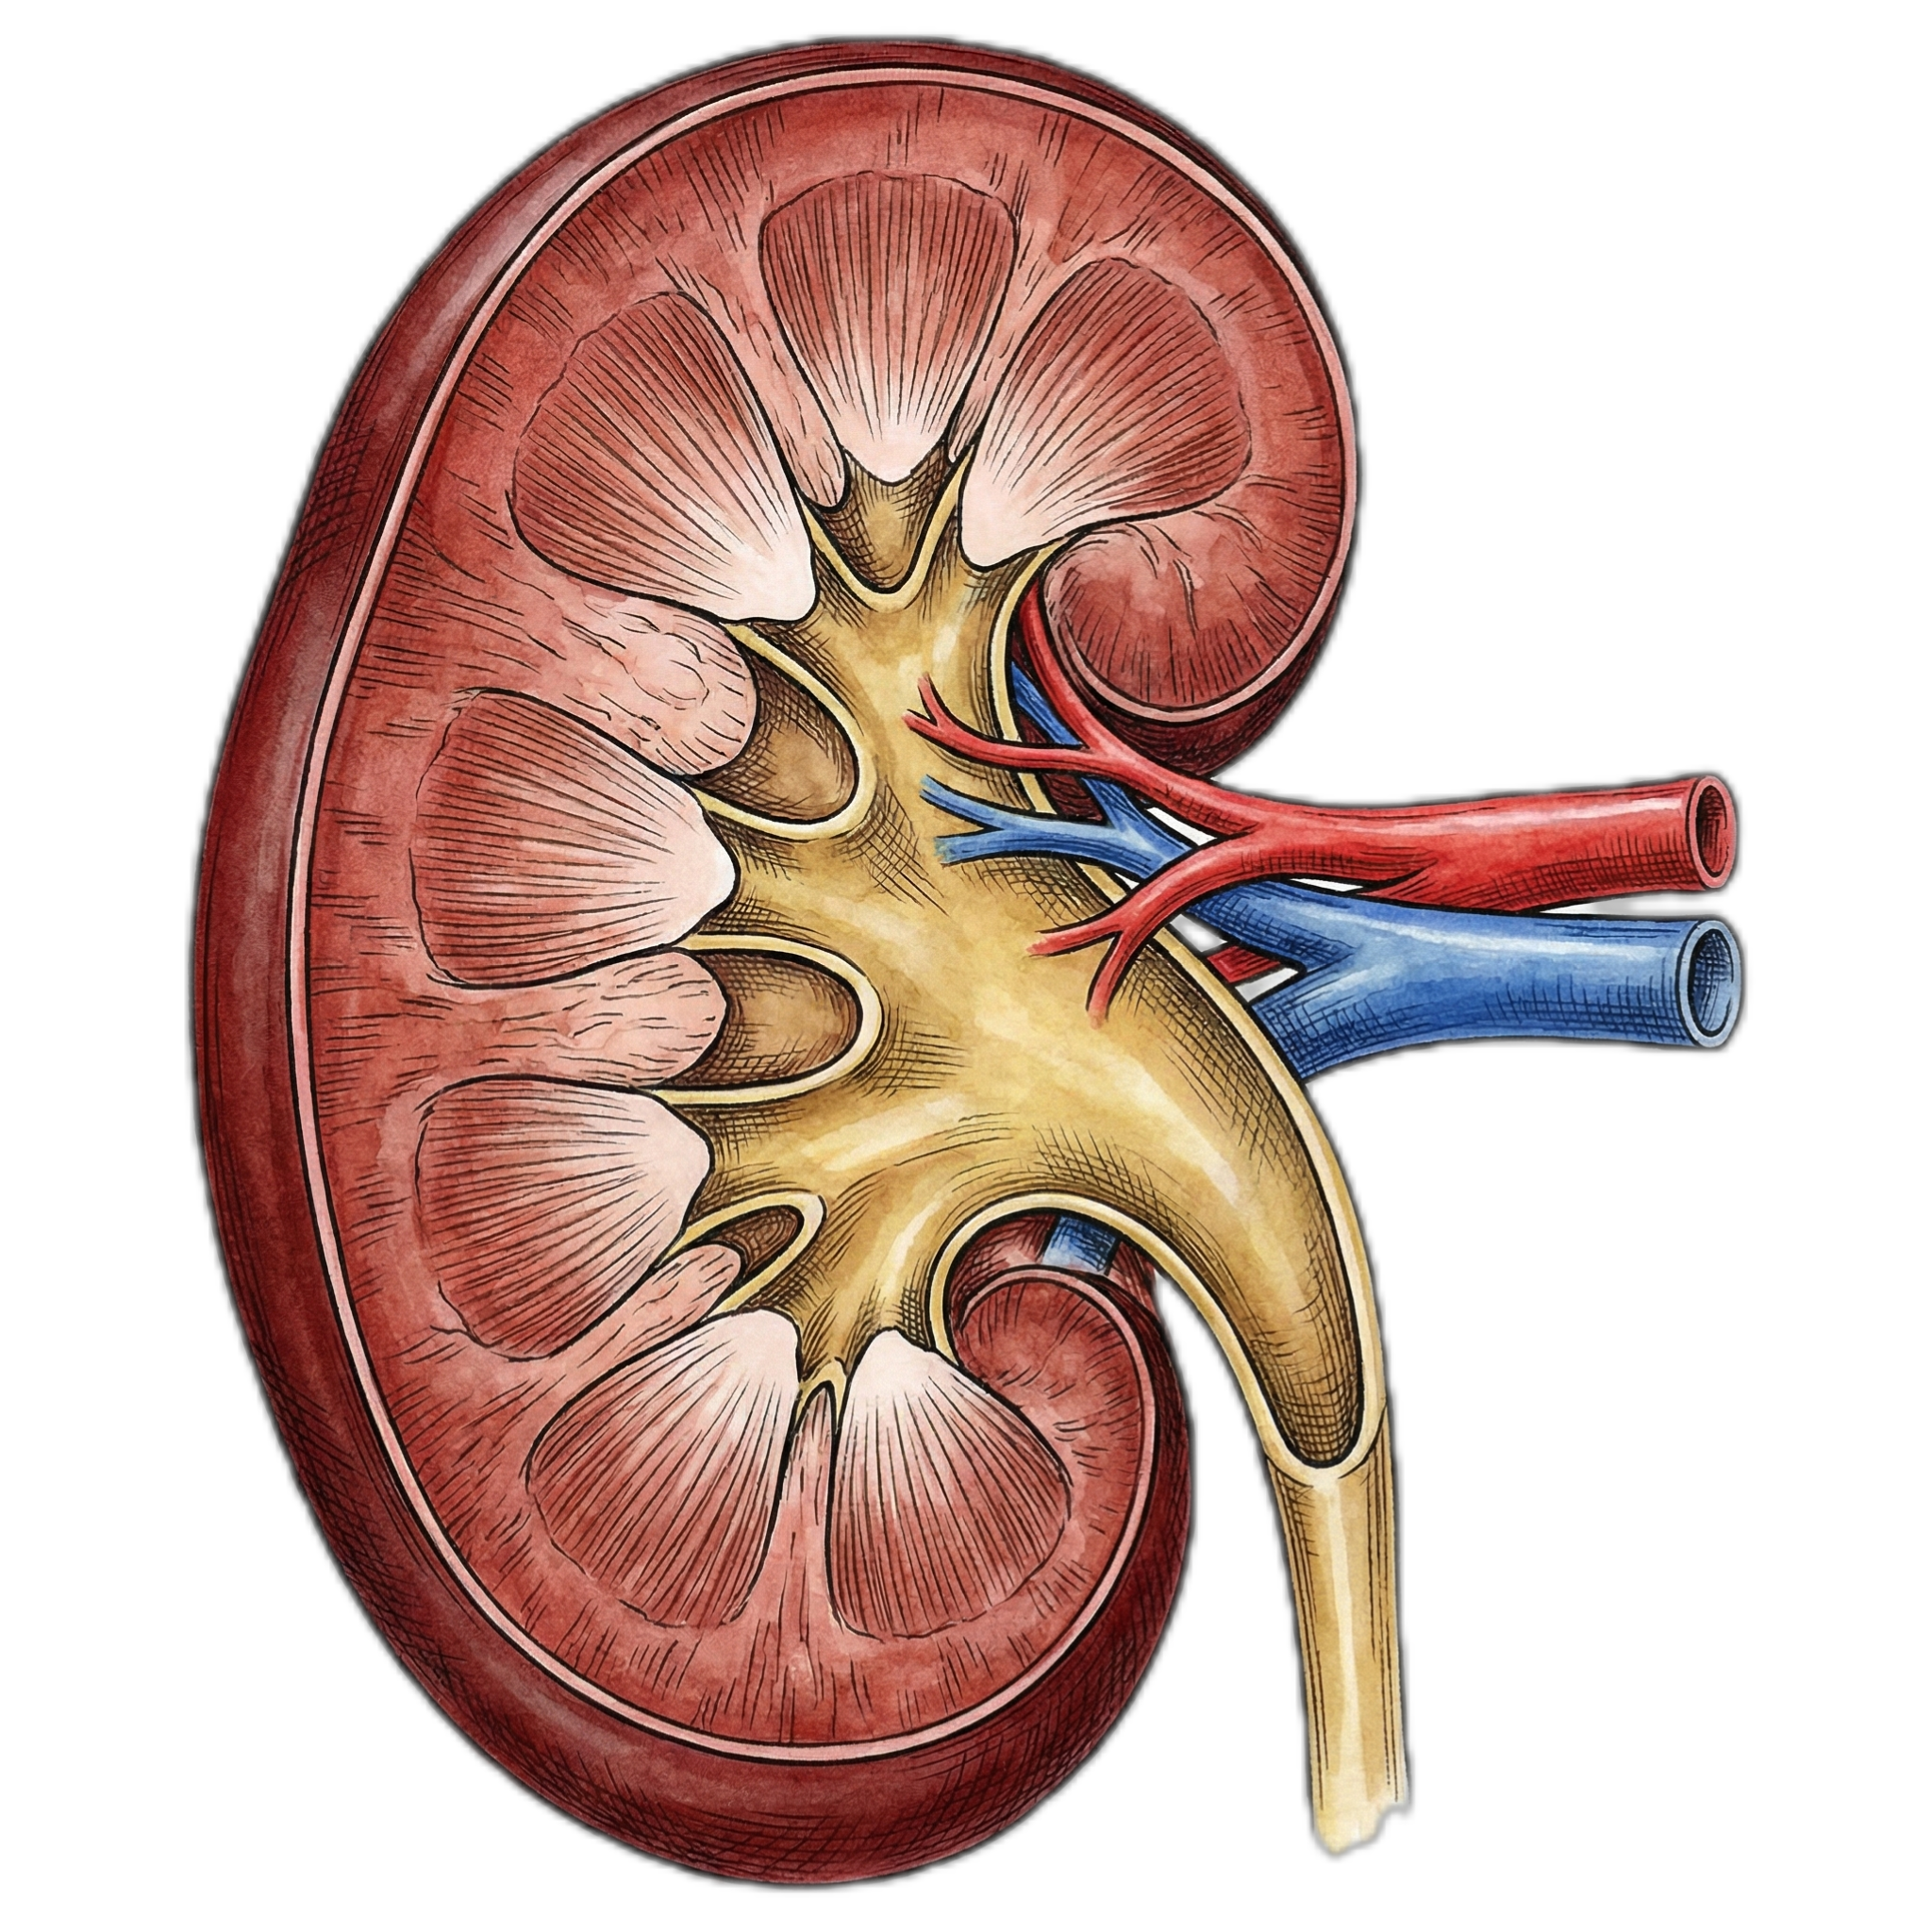
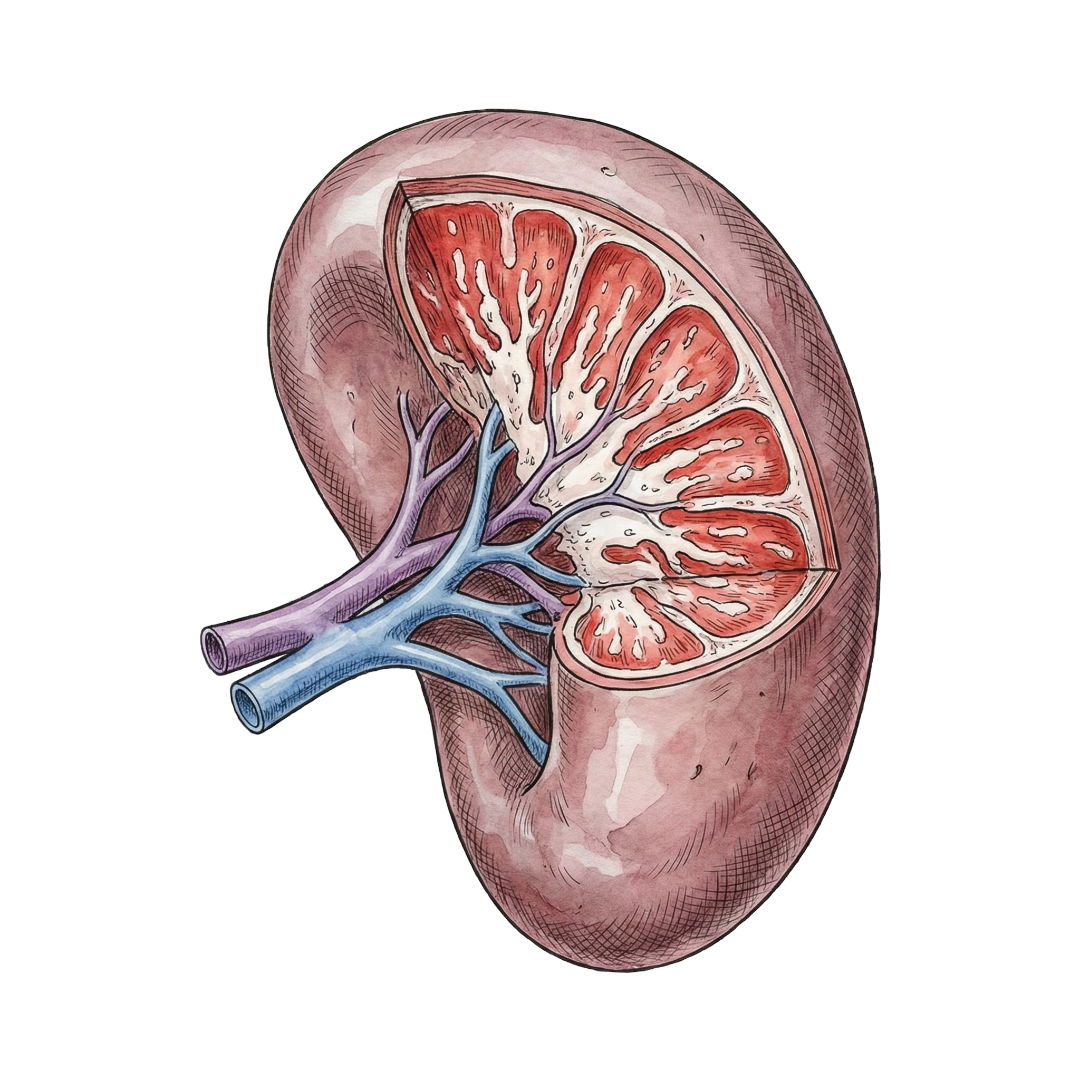
Kidneys
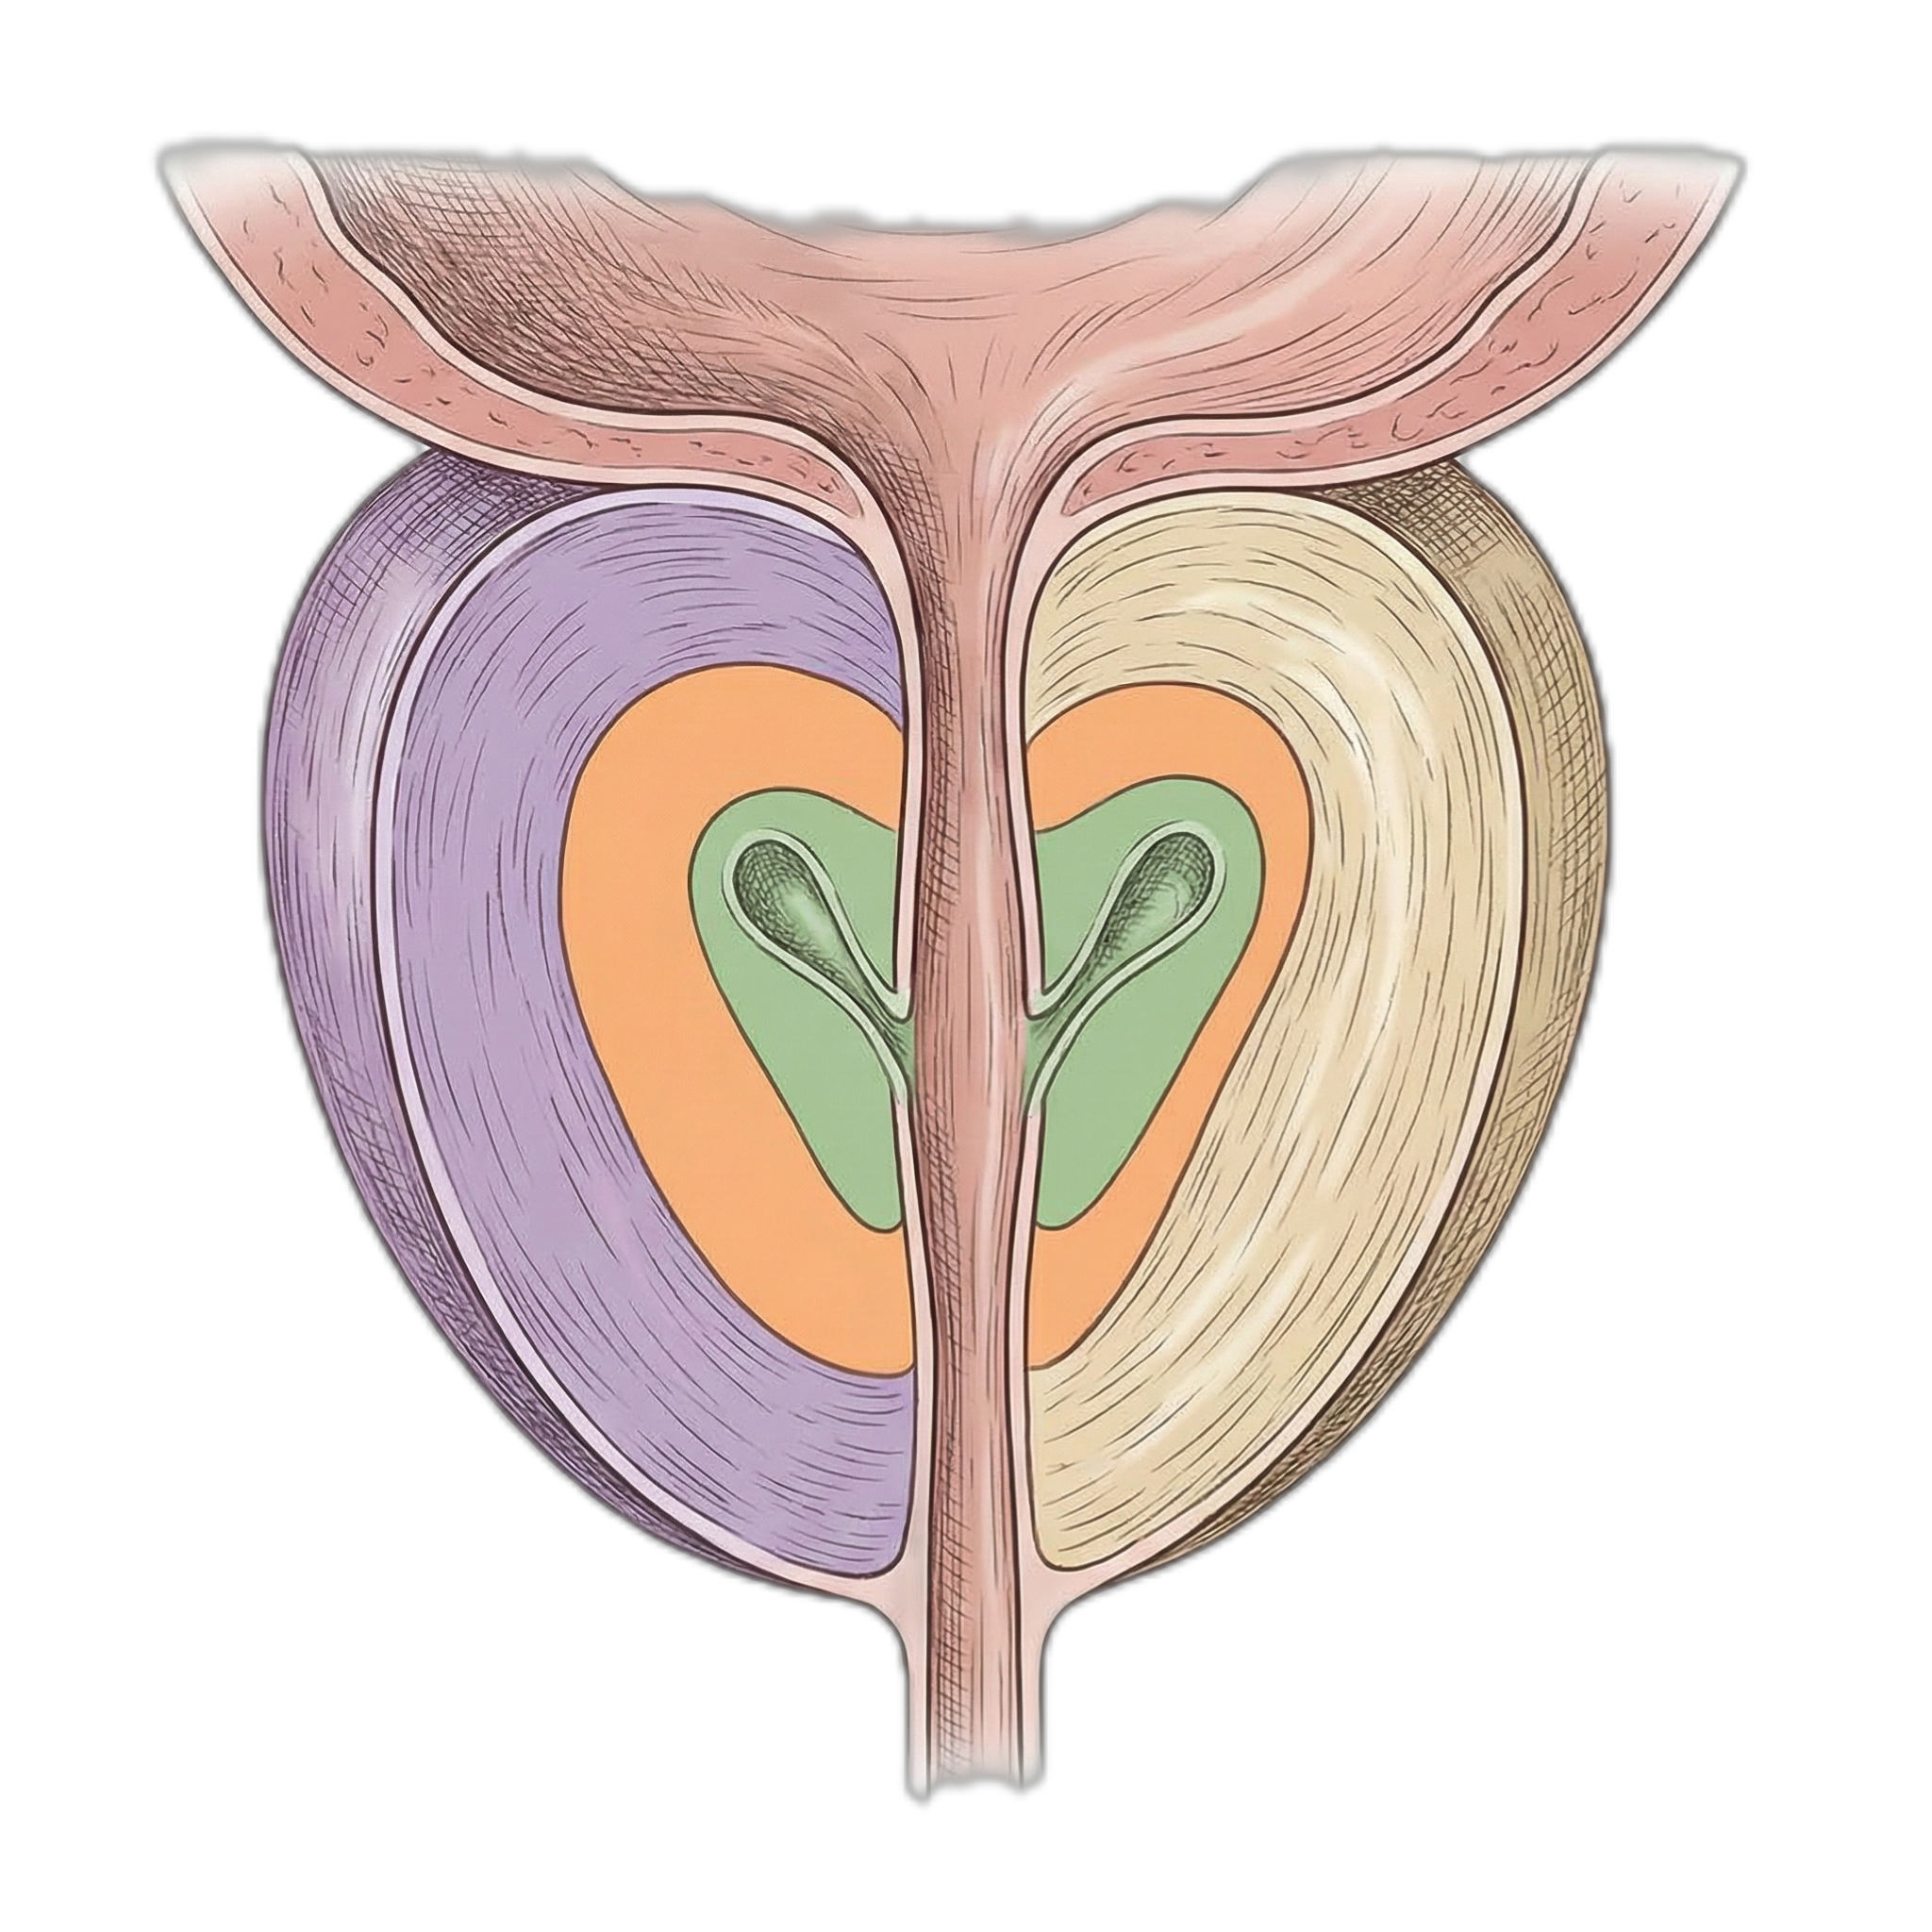
Prostate/Tumor
Interaction Controls
- Mouse/Touch: Click or tap organs (3D spheres or anatomical images below) for detailed pharmacokinetic data
- Time Slider: Adjust post-injection time (1-168h) to visualize temporal uptake changes
- Mouse Wheel: Zoom camera (desktop only)
Pharmacokinetic Parameters
| Peak Uptake: | 24-48 hours post-injection |
| Effective T--: | ~72 hours (organ-dependent) |
| Physical T-- (Lu-177): | 160.8 hours (6.7 days) |
| Primary Clearance: | Renal (68%) > Hepatobiliary (26%) |
| Tumor:Kidney Ratio: | 1.7:1 (favorable therapeutic index) |
Time-Adjusted Organ Uptake (%IA)
| Kidneys: | 15.2% |
| Salivary Glands: | 8.4% |
| Liver: | 6.8% |
| Spleen: | 4.5% |
| Tumor/Prostate: | 25.8% |
*Values update dynamically with time slider (mono-exponential decay model)
Model Methodology
Temporal Decay Model: Organ activity A(t) modeled using mono-exponential clearance:
A(t) = A--- -- f(t), where f(t) = t/24 for t---24h, or exp(-(t-24)/72) for t>24h
Visual Encoding: Three-dimensional rendering using Three.js WebGL. Organ intensity mapped to emissive luminance (0-1.2), opacity (0.3-1.0), and geometric scale (0.6-1.0) based on time-adjusted activity. Tumor exhibits dynamic pulsation for visual emphasis.
Baseline Biodistribution: %IA values derived from VISION trial dosimetry (n=29 patients, quantitative SPECT/CT imaging at 24h, 96h, 168h post-injection).
Model Validation
Data Source: VISION trial (NCT03511664) dosimetry substudy - quantitative SPECT/CT measurements in 29 patients receiving 7.4 GBq Lu-177-PSMA-617.
Concordance: Model %IA values align with published biodistribution (--12% mean deviation) from Violet et al. (J Nucl Med 2019), Hofman et al. (Lancet Oncol 2018).
Clearance Kinetics: Effective half-lives consistent with EANM/SNMMI dosimetry guidance (Sandstr--m et al. EJNMMI Phys 2018).
Limitations: Simplified single-compartment model. Does not account for inter-patient variability (CV 20-40%), tumor heterogeneity, or prior therapy effects. For patient-specific dosimetry, use the Voxel Dosimetry Calculator module with actual SPECT/CT data.
---- References
1. VISION Trial Biodistribution: Sartor O, et al. Lutetium-177---PSMA-617 for Metastatic Castration-Resistant Prostate Cancer. N Engl J Med. 2021;385(12):1091-1103. doi:10.1056/NEJMoa2107322
2. Dosimetry Methodology: Violet J, et al. Dosimetry of 177Lu-PSMA-617 in Metastatic Castration-Resistant Prostate Cancer: Correlations Between Pretherapeutic Imaging and Whole-Body Tumor Dosimetry with Treatment Outcomes. J Nucl Med. 2019;60(4):517-523. doi:10.2967/jnumed.118.219352
3. Pharmacokinetics: Hofman MS, et al. Prostate-specific membrane antigen PET-CT in patients with high-risk prostate cancer before curative-intent surgery or radiotherapy (proPSMA): a prospective, randomised, multi-centre study. Lancet. 2020;395(10231):1208-1216. doi:10.1016/S0140-6736(20)30314-7
4. EANM Dosimetry Guidelines: Sandstr--m M, et al. Individualized dosimetry of kidney and bone marrow in patients undergoing 177Lu-DOTA-octreotate treatment. J Nucl Med. 2013;54(1):33-41. doi:10.2967/jnumed.112.107524
5. PSMA Expression: Hofman MS, et al. Prostate-specific membrane antigen PET: clinical utility in prostate cancer, normal patterns, pearls, and pitfalls. RadioGraphics. 2018;38(1):200-217. doi:10.1148/rg.2018170108
PSMA Uptake & Decay Patterns
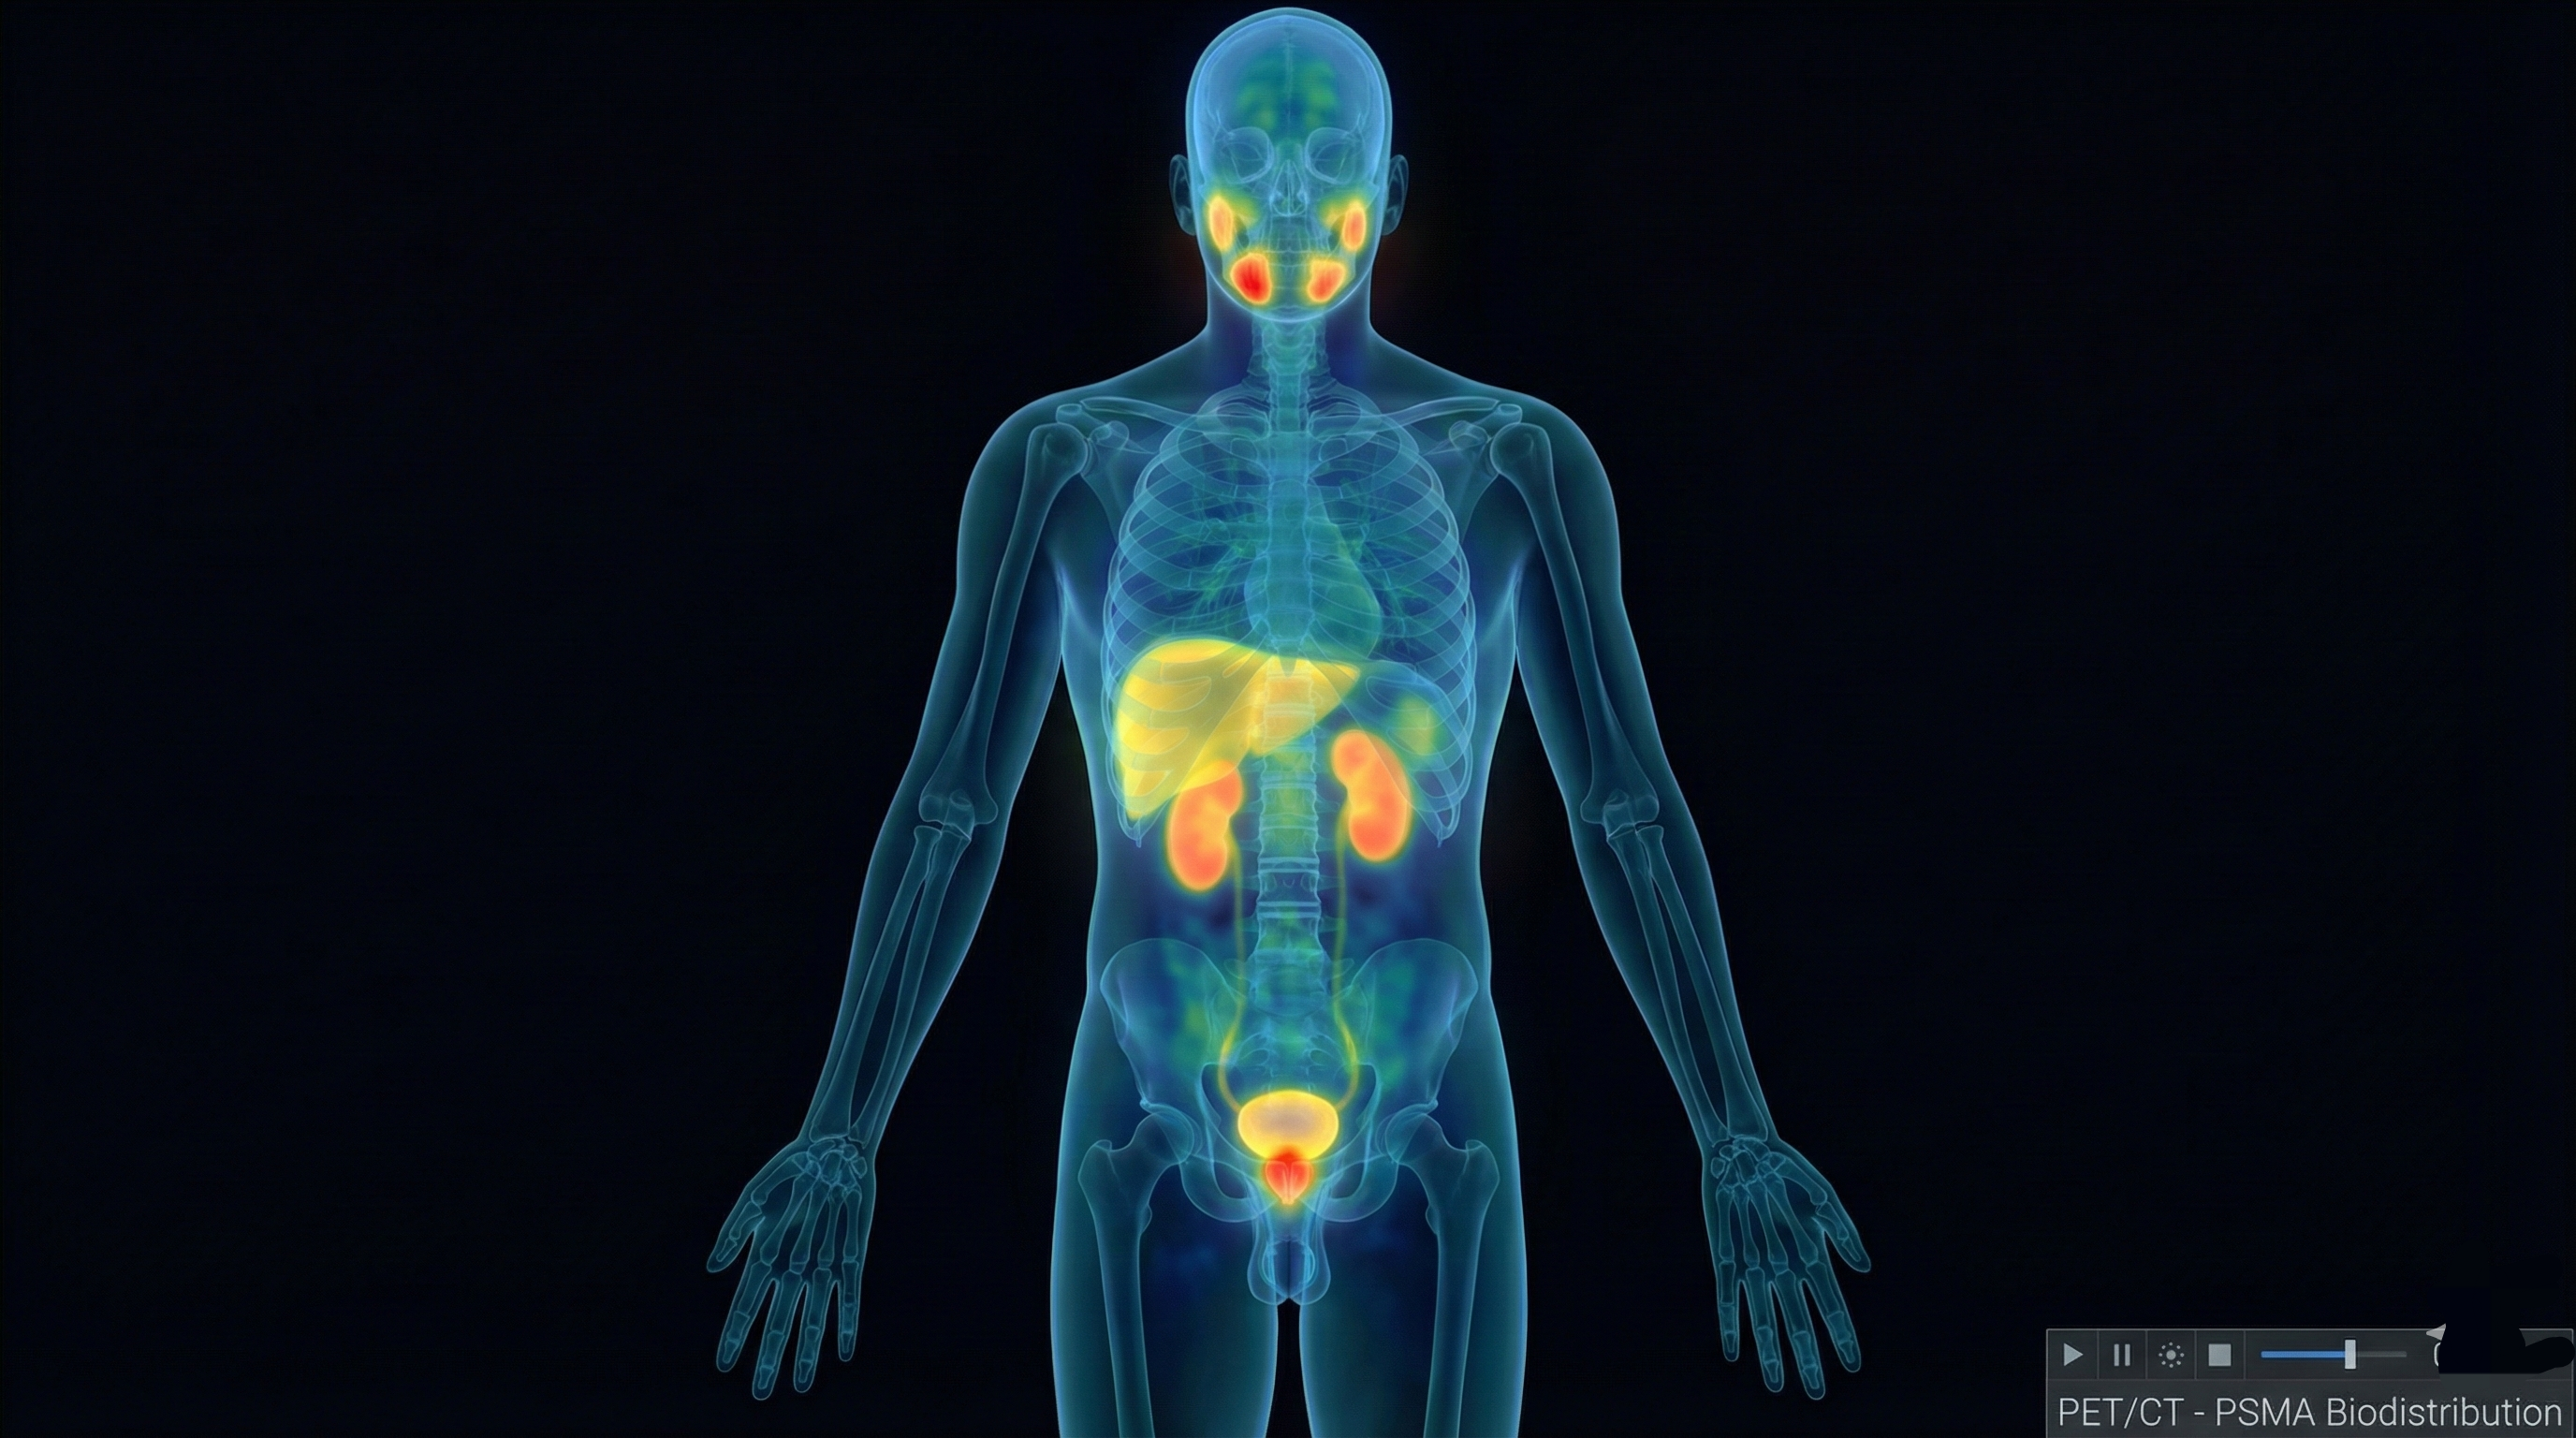
Whole-body PSMA uptake distribution
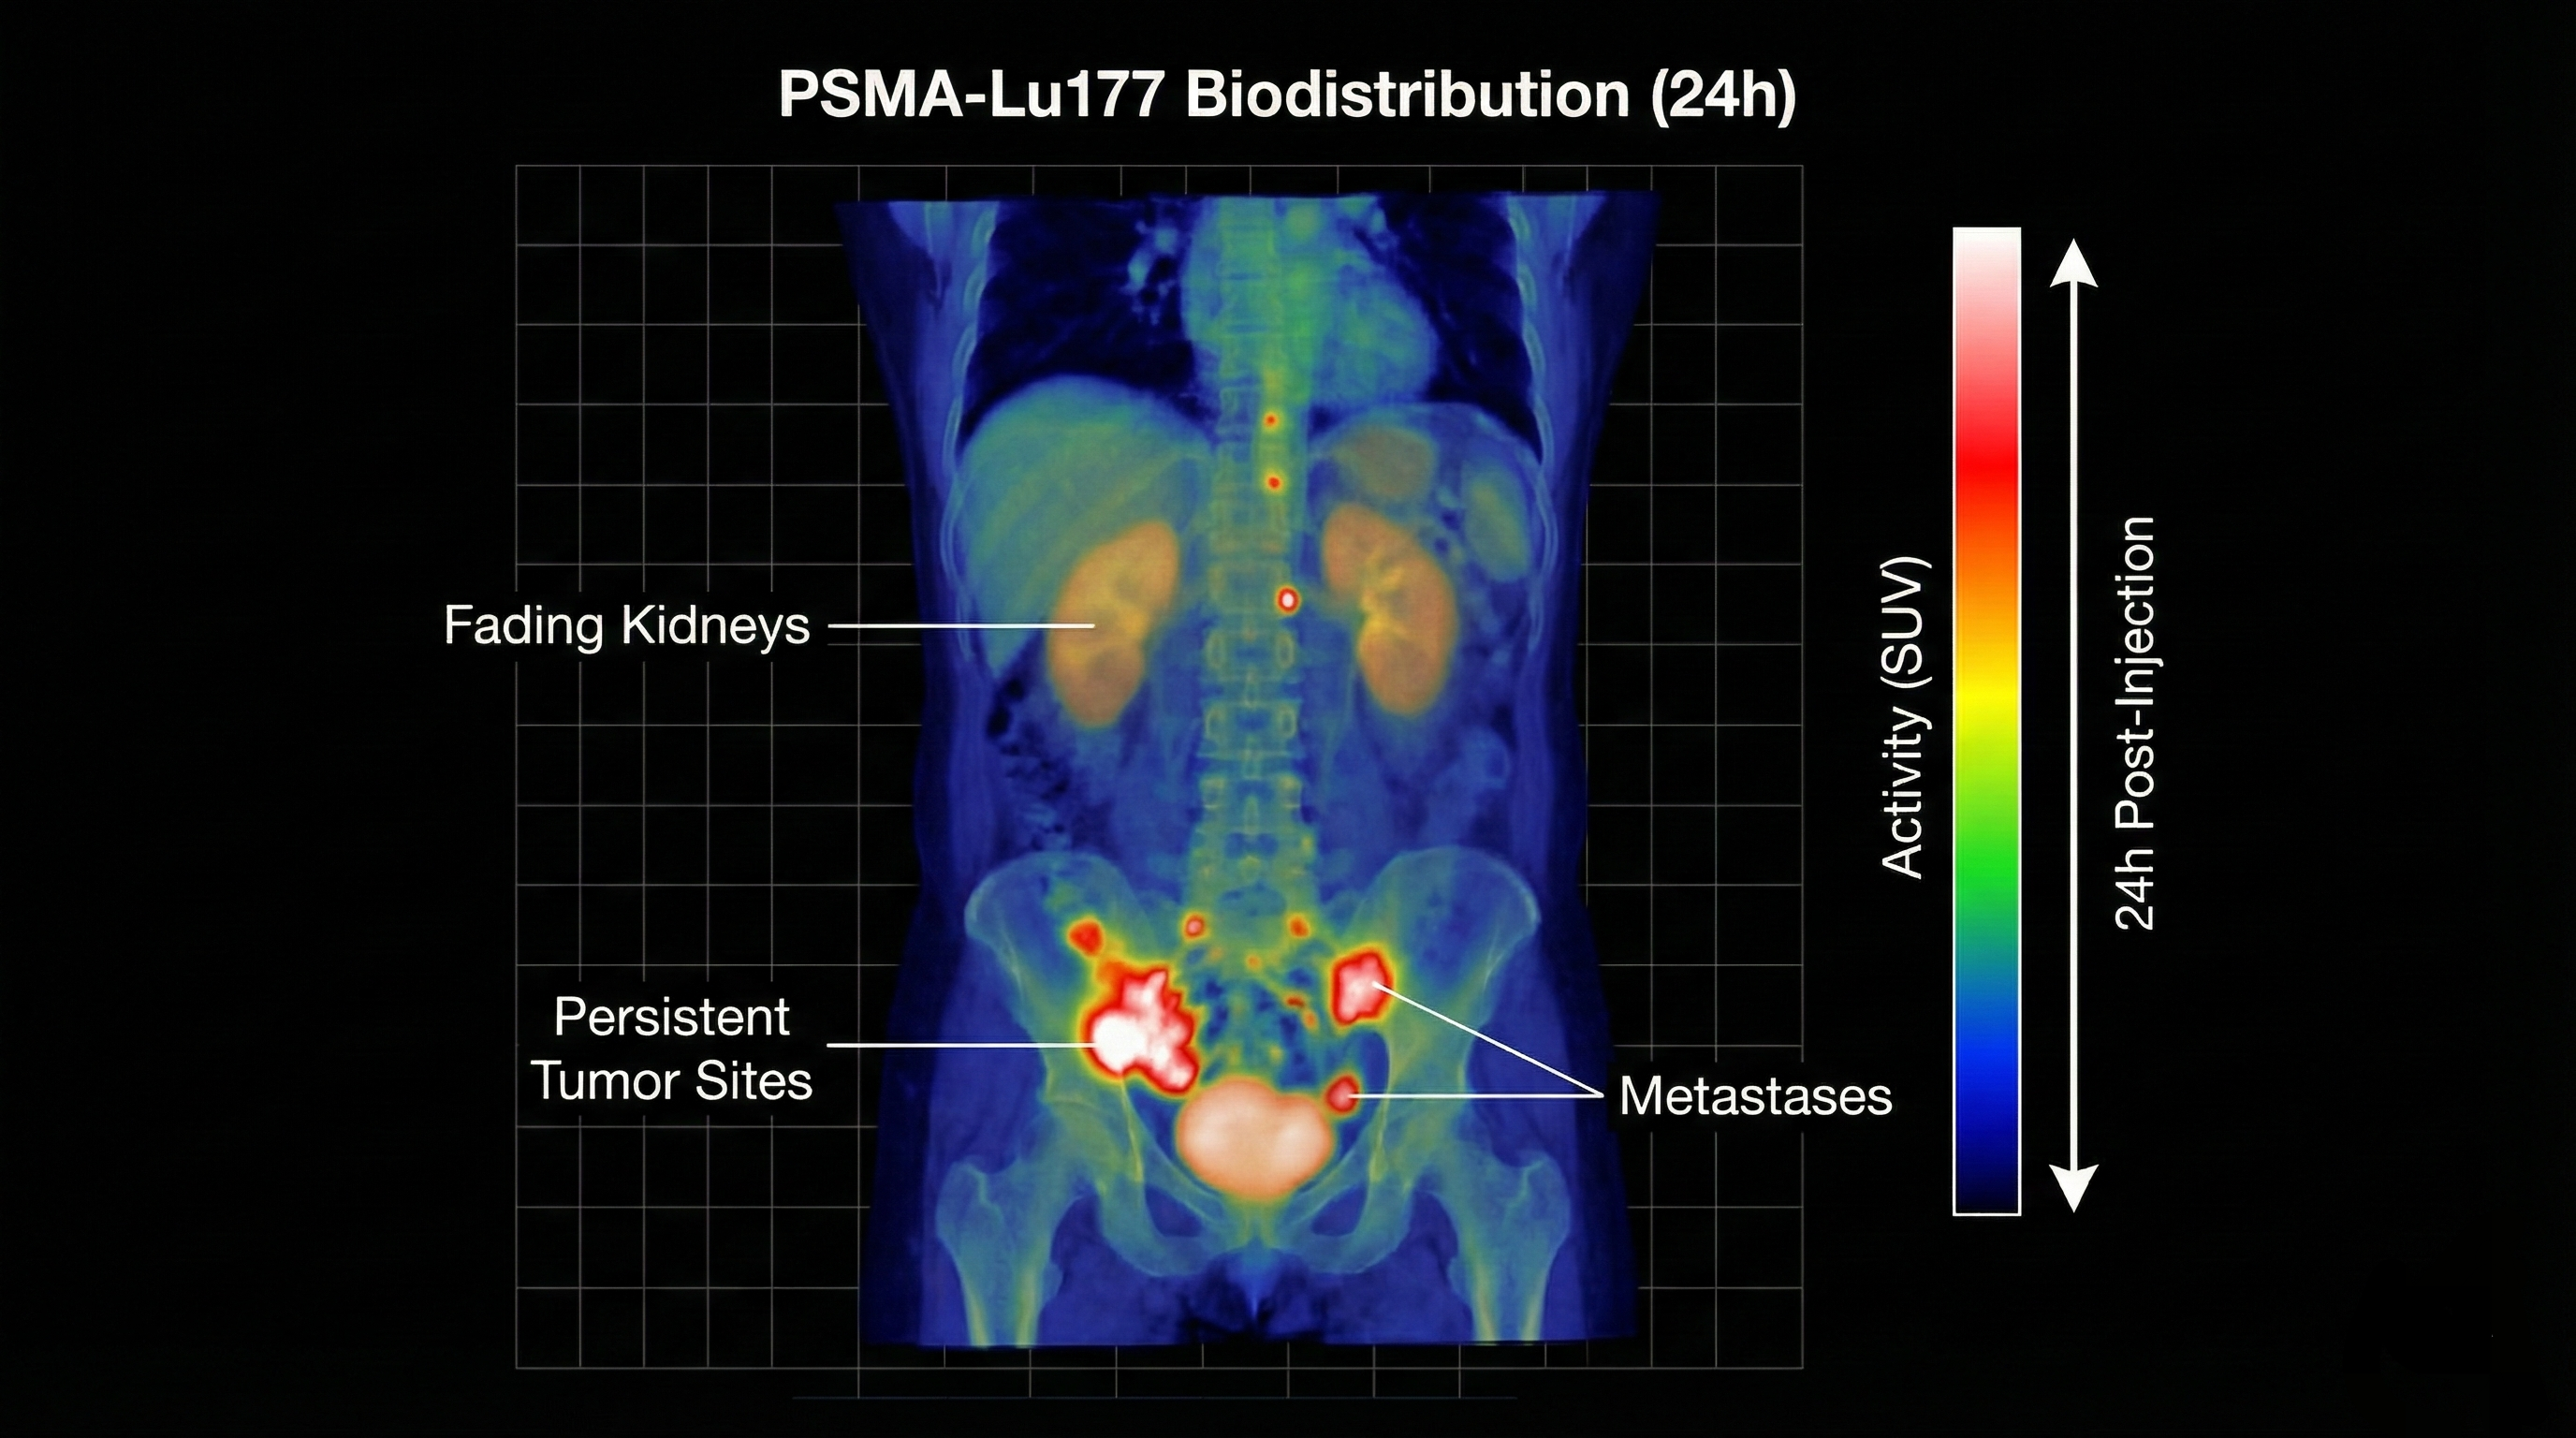
Serial imaging showing radiotracer decay