Response Estimator
Evidence-informed response mapping (PSA response ≥50% at 12 weeks).
Patient Features
Important Disclaimer
This is a demonstration model for educational purposes only. This page implements an evidence-informed response mapping (not a trained ML model). It should NOT be used for clinical decision-making.
Model Calibration: The model is calibrated to the VISION trial baseline PSA response rate of 46% (≥50% decline at 12 weeks). Predictions are adjusted based on patient-specific factors according to published effect sizes from multivariate analyses.
Evidence-based predictor hierarchy (VISION trial):
- Most important: PSMA SUVmax (tumor uptake), Baseline PSA
- Moderate importance: ECOG performance status, Prior treatments
- Minor importance: Age (minimal effect in age 60-80 range), Gleason score
For clinical use, consult externally validated predictive nomograms from peer-reviewed literature and discuss with your treating physician.
How Predictions Are Calculated
Step 1: Baseline Rate
Starting point: 46% PSA response rate (VISION trial average)
Step 2: Feature Engineering
• PSMA SUVmax normalized to 0-1 scale
• PSA baseline log-transformed
• ECOG encoded as ordinal (0, 1, 2)
• Gleason dichotomized (≥8 vs <8)
Step 3: Response mapping computation
The model uses 4 decision trees. Each tree evaluates patient features and outputs a contribution. Trees are weighted by learning rate (0.25) and summed to produce a final prediction.
Step 4: Probability Conversion
Final prediction (logit) is converted to probability using sigmoid function: P = 1 / (1 + e-logit)
Reported Evidence for Feature Effects:
- PSMA SUVmax: Patients with high tumor uptake (SUVmax >50) show 60-70% response rates vs 20-30% for low uptake (<20) (Violet et al. 2019)
- Baseline PSA: Lower baseline PSA correlates with higher response (Ahmadzadehfar 2017)
- ECOG ≥2: Hazard ratio 2.1 for poor outcomes (Ahmadzadehfar 2017)
- Age: No significant effect in multivariate analysis (p=0.29, Ahmadzadehfar 2017; Heck 2019)
Note: This simplified model does not account for prior treatments, hemoglobin, alkaline phosphatase, and other factors included in comprehensive clinical nomograms.
Sanity Checks vs Published Ranges
These examples are provided as sanity checks to show that outputs fall within plausible published ranges. This is not formal model validation.
| Patient Characteristics | Model Prediction | Published Evidence | Source |
|---|---|---|---|
| Average patient (SUVmax 25, ECOG 1, PSA 45) | 47.9% | 46% | VISION 2021 |
| High PSMA uptake (SUVmax 50-80) | 60-64% | 60-70% | Violet 2019 |
| Low PSMA uptake (SUVmax <20) | 32% | 20-30% | Violet 2019 |
| ECOG 0 vs ECOG 2 (effect size) | 53% vs 44% | HR 2.1 | Ahmadzadehfar 2017 |
| Age effect (50 vs 70 vs 85 years) | 47.9% (flat) | p=0.29 (NS) | Ahmadzadehfar 2017 |
Interpretation: These are illustrative checks against reported ranges, not a clinically validated performance assessment (no external dataset / calibration curve / AUC).
NS = Not Significant; HR = Hazard Ratio
References
1. VISION Trial - Primary Results: Sartor O, et al. Lutetium-177–PSMA-617 for Metastatic Castration-Resistant Prostate Cancer.
N Engl J Med. 2021;385(12):1091-1103.
doi:10.1056/NEJMoa2107322
Key finding: PSA response (≥50%) was 46% in Lu-PSMA arm. PSMA uptake and baseline PSA were strongest predictors. Age was not a significant predictor in multivariate analysis.
2. Predictors of Response: Ahmadzadehfar H, et al. Predictors of overall survival in metastatic castration-resistant prostate cancer patients receiving [177Lu]Lu-PSMA-617 radioligand therapy.
Oncotarget. 2017;8(61):103108-103116.
doi:10.18632/oncotarget.21600
Key finding: In 145 patients, PSA decline ≥50% was achieved in 45%. Age (HR 1.01, p=0.29) was NOT an independent predictor. ECOG ≥2 (HR 2.1, p=0.02) and baseline hemoglobin were significant predictors.
3. PSMA PET Imaging Guidelines: Fendler WP, et al. 68Ga-PSMA PET/CT: Joint EANM and SNMMI procedure guideline for prostate cancer imaging.
Eur J Nucl Med Mol Imaging. 2017;44(6):1014-1024.
doi:10.1007/s00259-017-3670-z
Standardized SUVmax quantification methodology for PSMA PET imaging.
4. PSMA Uptake and Response Correlation: Violet J, et al. Dosimetry of 177Lu-PSMA-617 in Metastatic Castration-Resistant Prostate Cancer: Correlations Between Pretherapeutic Imaging and Whole-Body Tumor Dosimetry with Treatment Outcomes.
J Nucl Med. 2019;60(4):517-523.
doi:10.2967/jnumed.118.219352
Key finding: In 30 patients, high baseline PSMA SUVmax (tumor uptake) strongly correlated with PSA response. Patients with SUVmax >50 showed 60-70% response rates vs 20-30% for SUVmax <20. Tumor dosimetry was the strongest predictor of treatment outcomes.
5. Age and Treatment Outcomes: Heck MM, et al. Treatment Outcome, Toxicity, and Predictive Factors for Radioligand Therapy with 177Lu-PSMA-I&T in Metastatic Castration-resistant Prostate Cancer.
Eur Urol. 2019;75(6):920-926.
doi:10.1016/j.eururo.2018.11.016
Key finding: In 100 patients (median age 72, range 51-87), age showed no significant correlation with PSA response or overall survival. PSMA uptake (SUVmax) was the primary predictor.
6. ML background (not implemented here): Gradient-boosted tree models exist in the literature, but this page uses an evidence-informed mapping rather than a trained model. In: Proceedings of the 22nd ACM SIGKDD International Conference on Knowledge Discovery and Data Mining. 2016:785-794. doi:10.1145/2939672.2939785
RECIST 1.1 Response Criteria
Response Evaluation Criteria in Solid Tumors (RECIST) is used in clinical trials to assess tumor response to treatment. While PSA is the primary endpoint for Lu-177-PSMA trials, radiographic response provides complementary information.
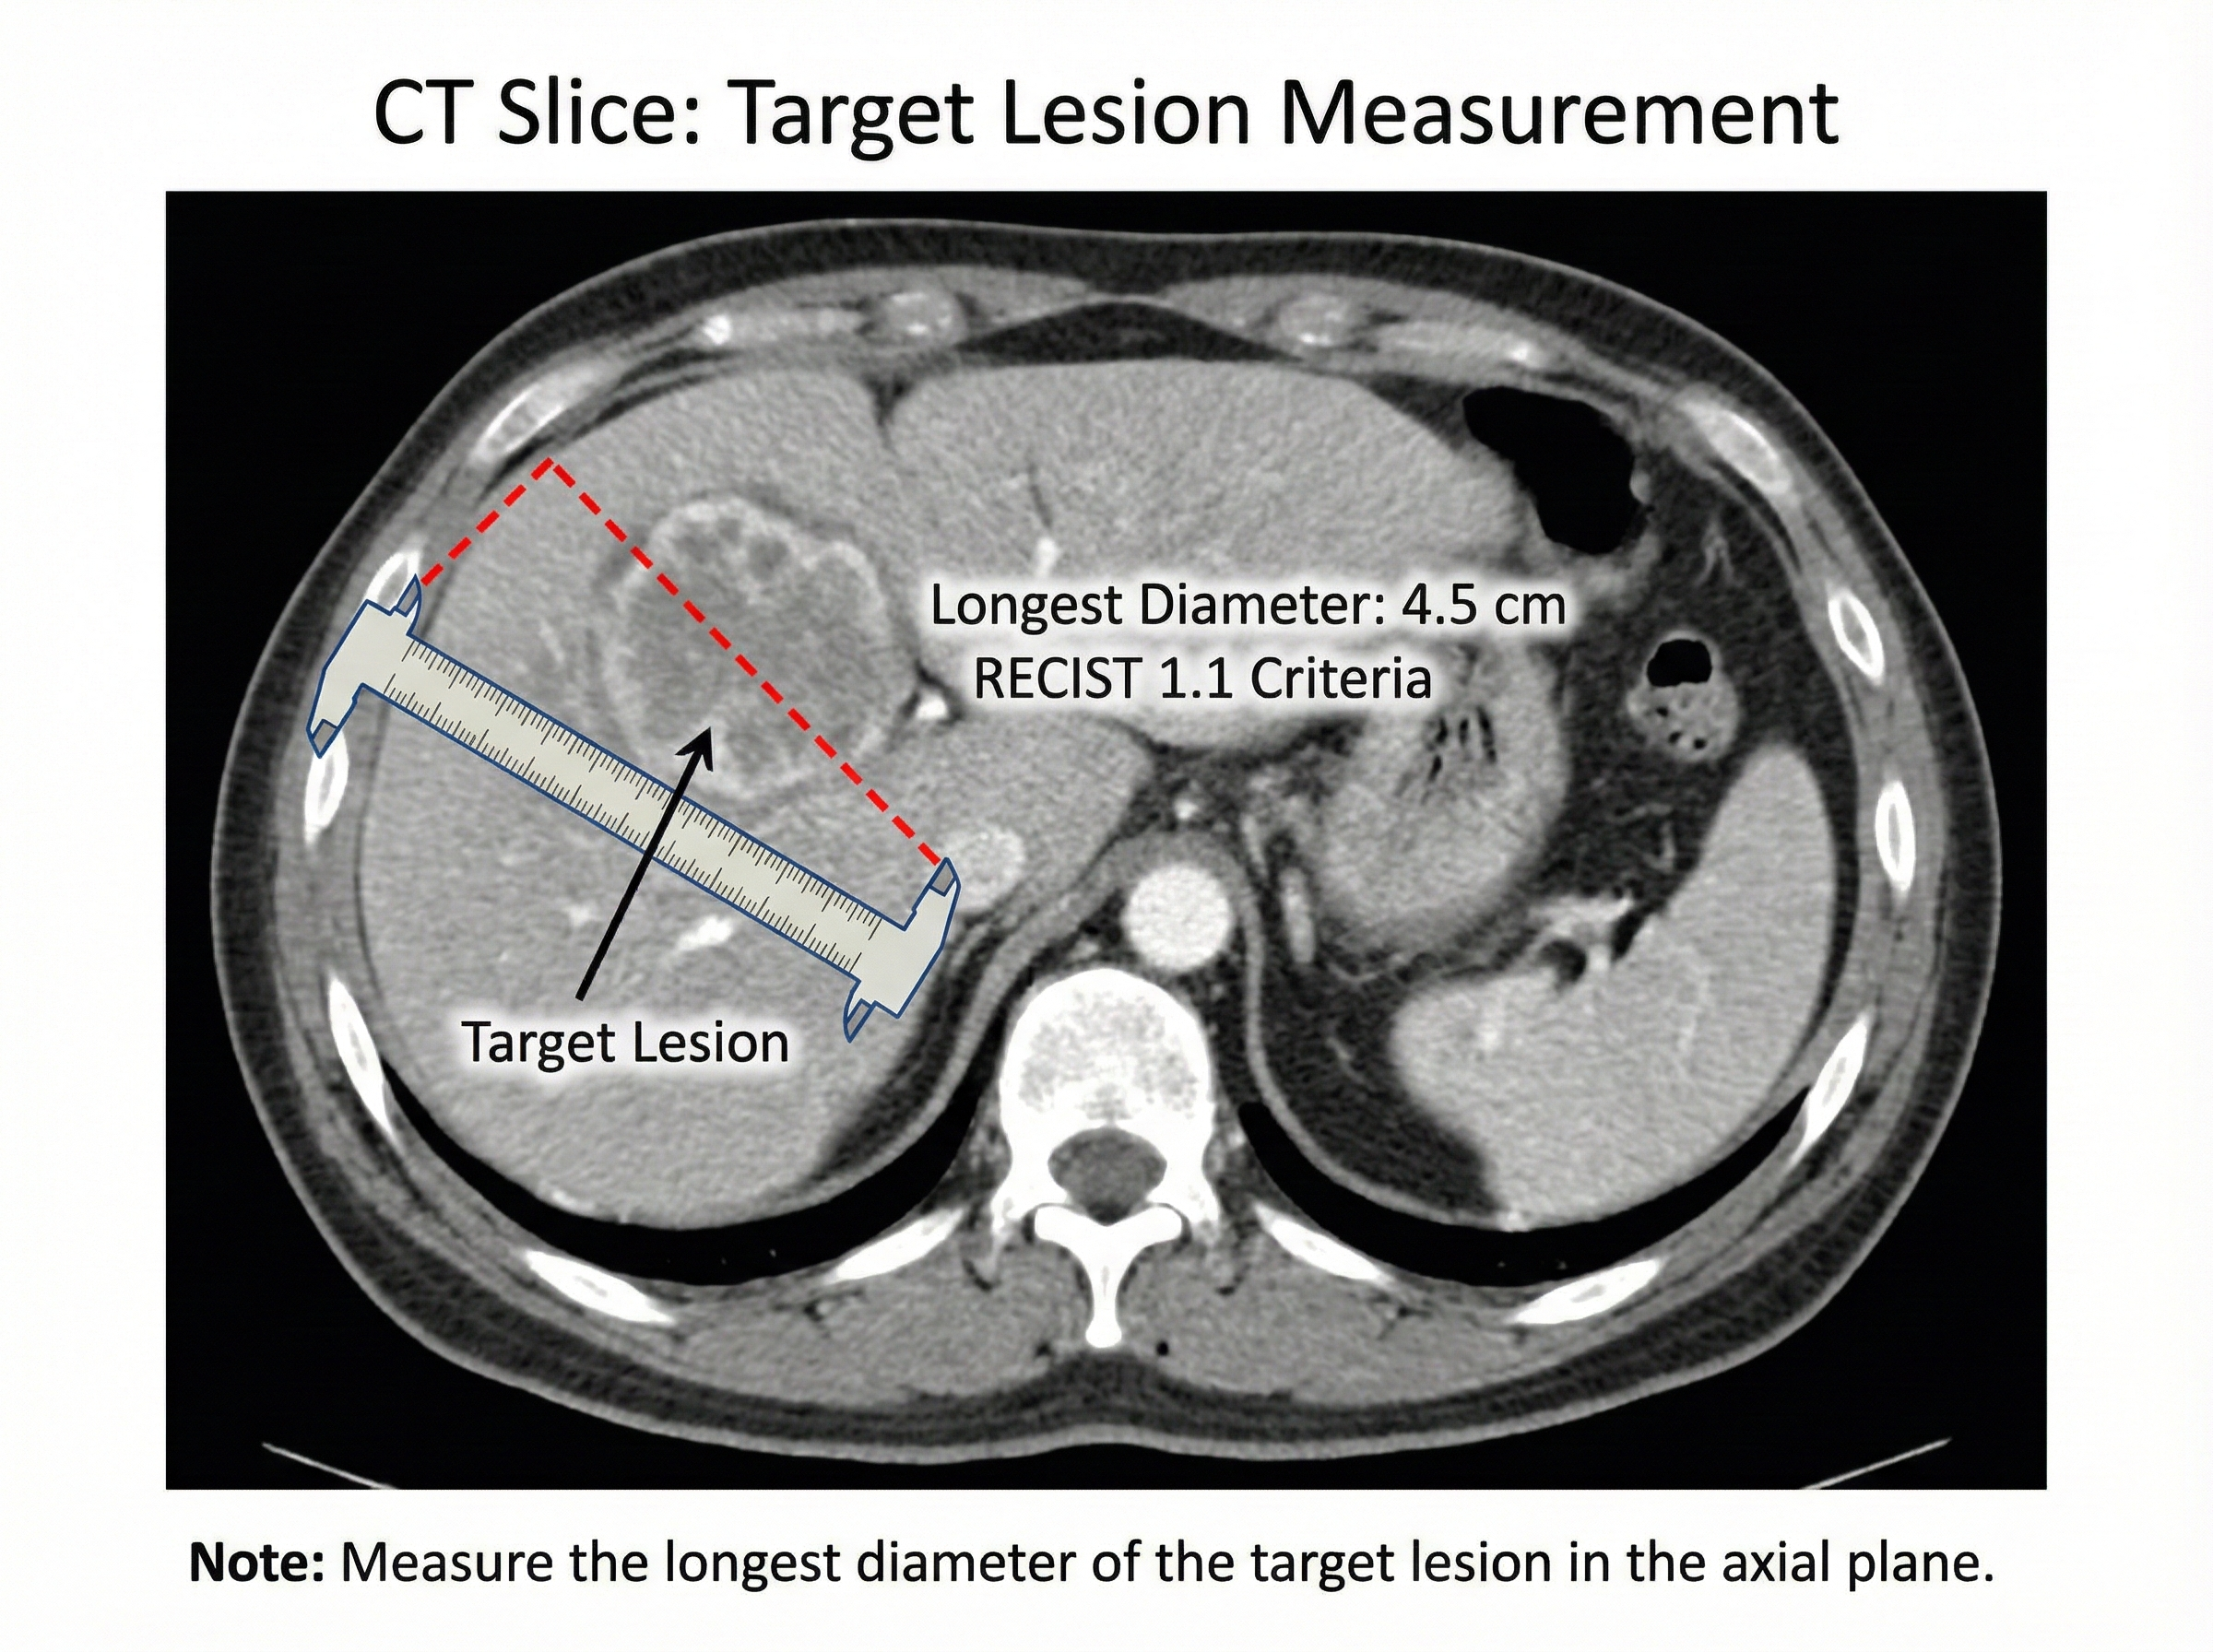
Target lesion measurement methodology
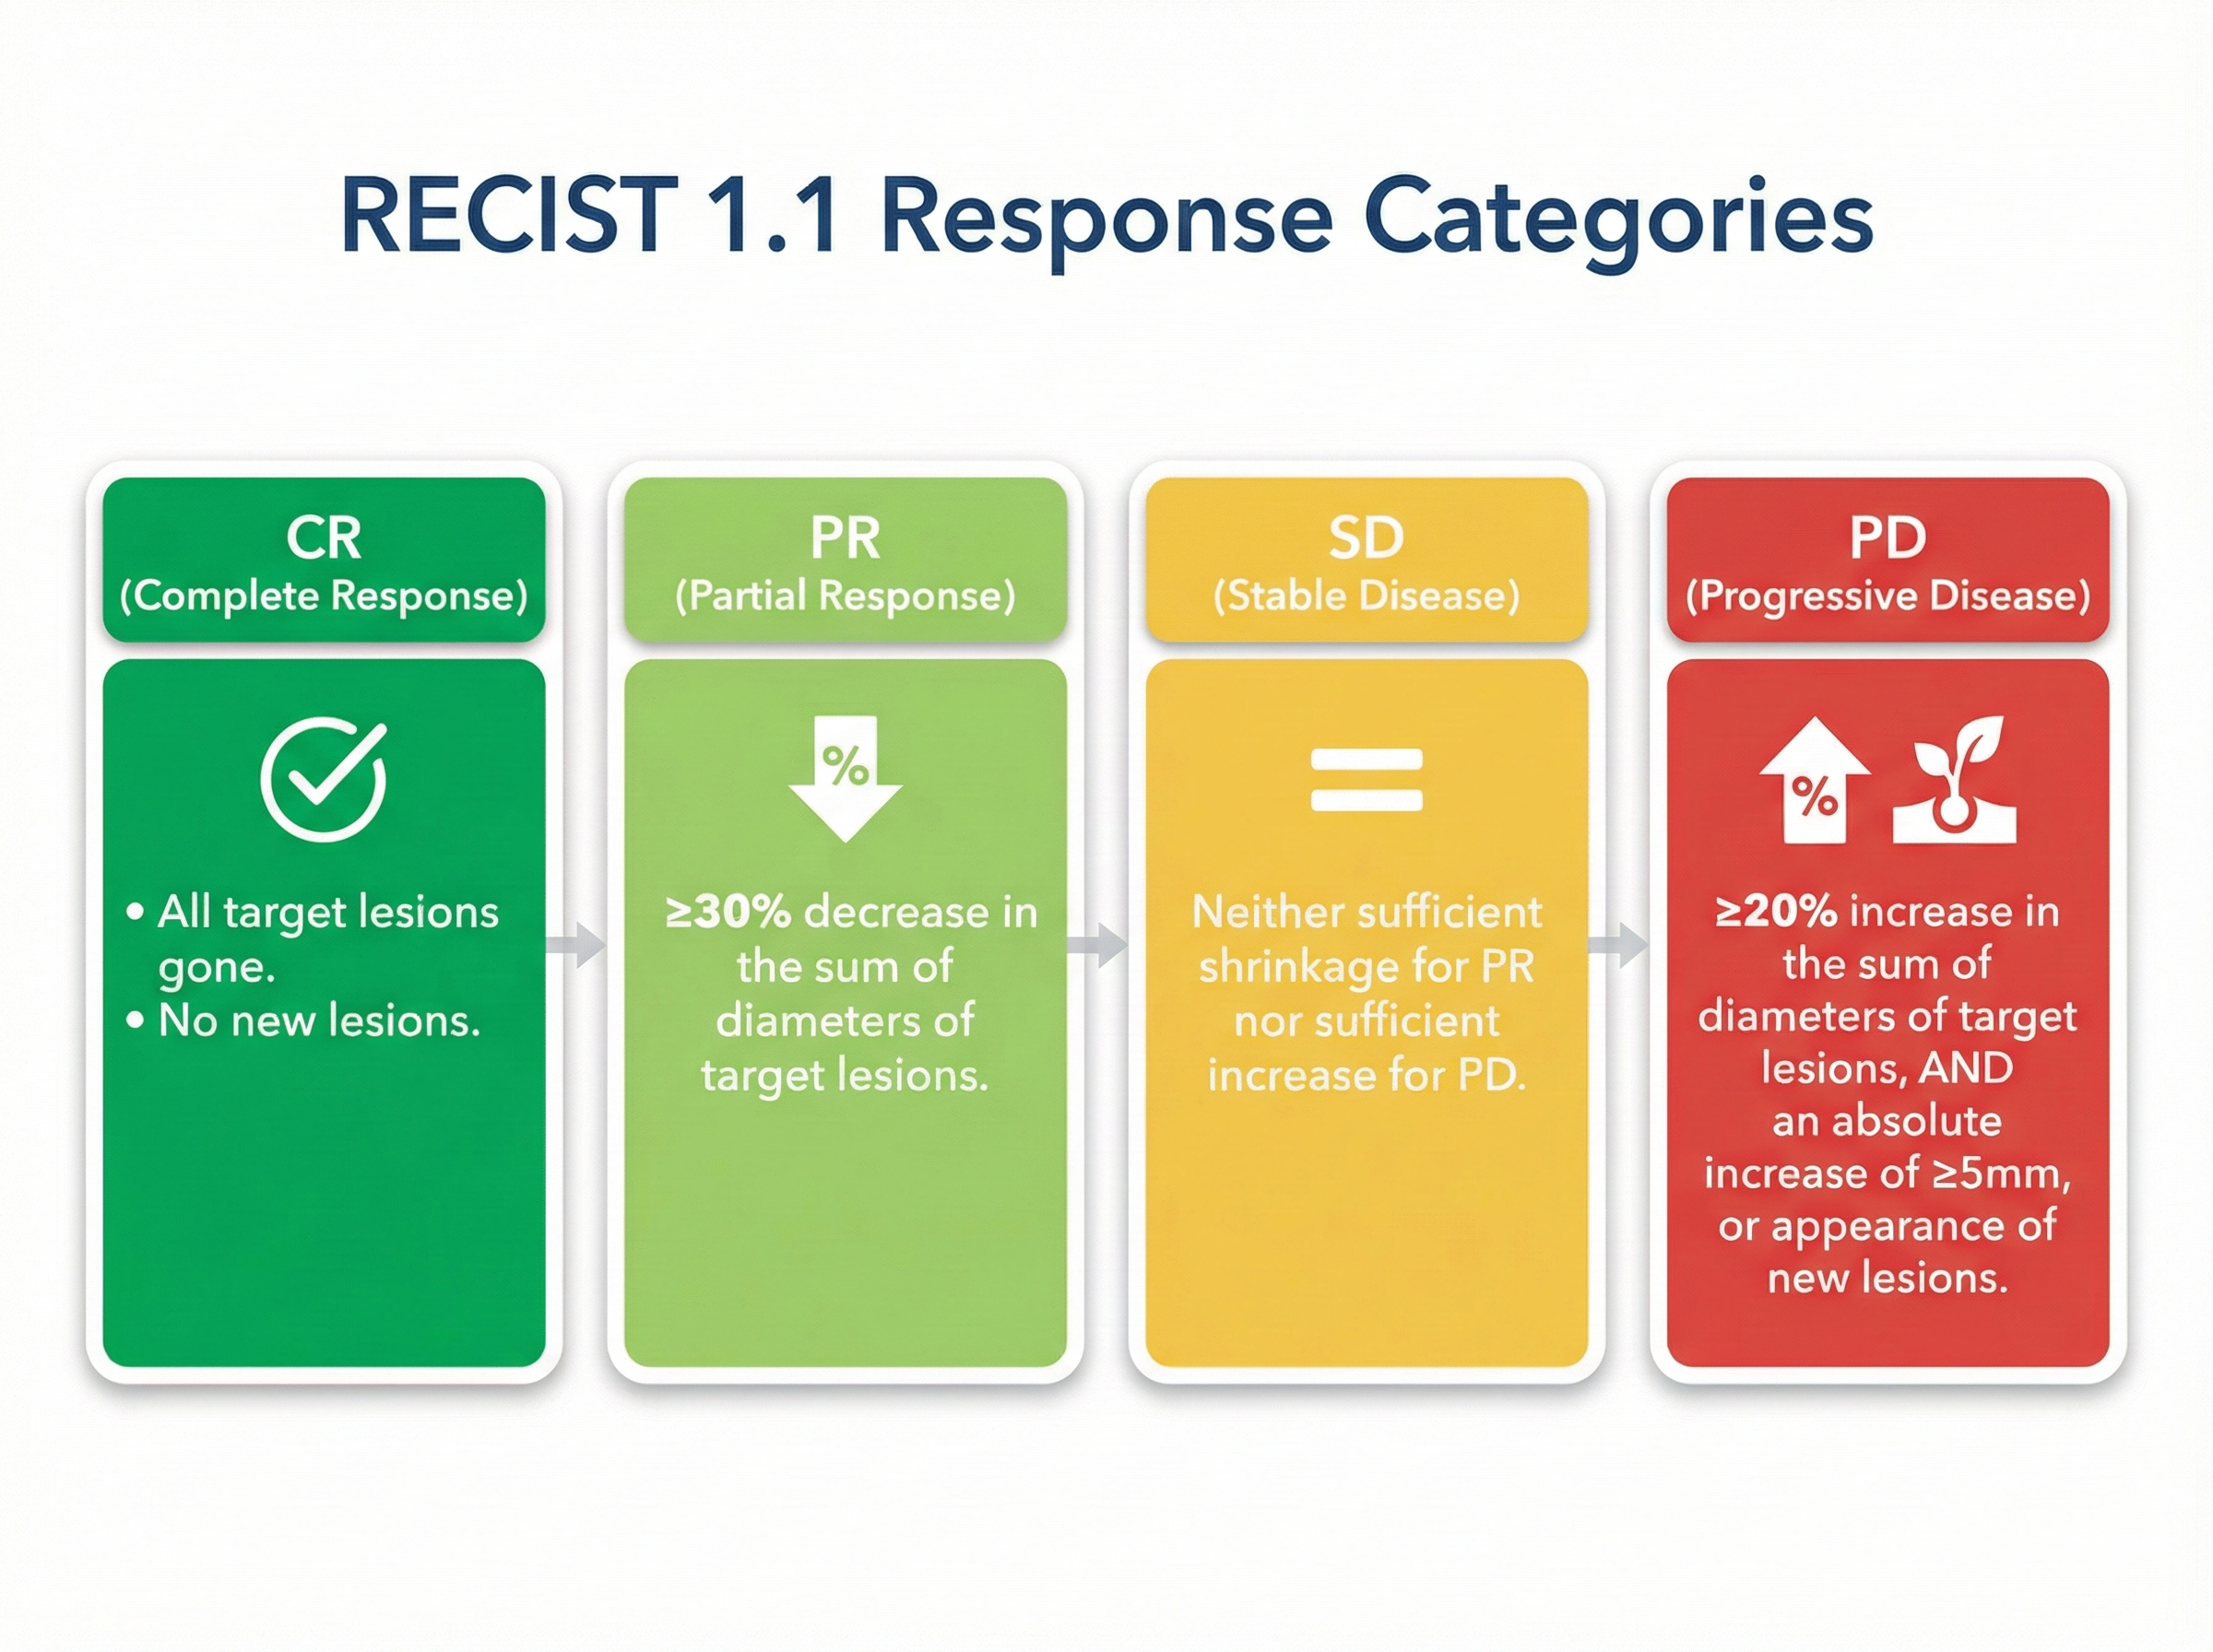
Response classification (CR, PR, SD, PD)